 Data Masking/Protection
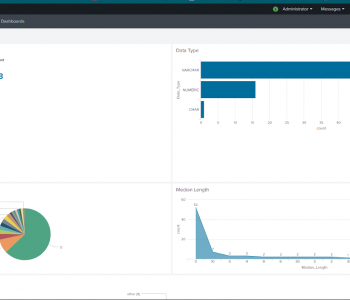
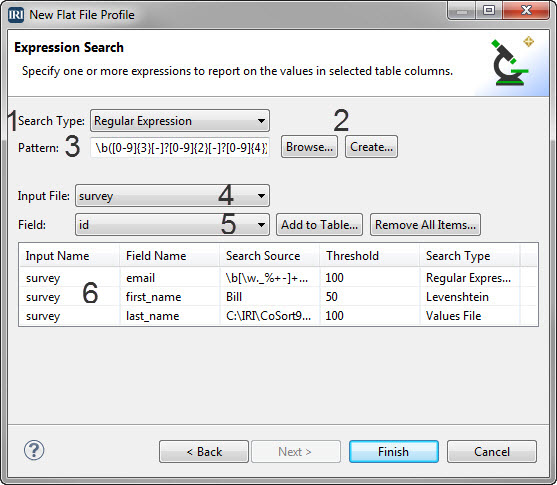
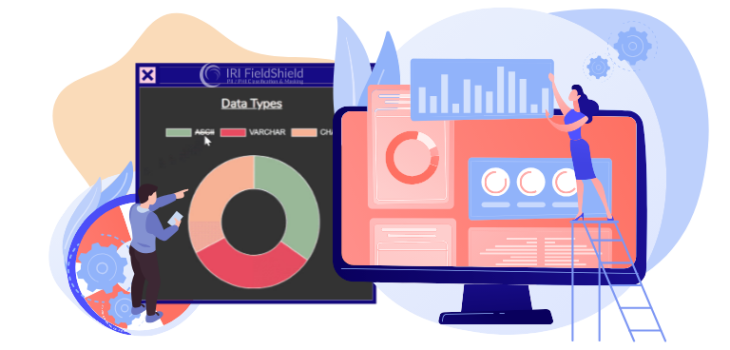
FieldShield PII Discovery Charts
Among the PII data profiling and data discovery tools in the IRI FieldShield data masking product is an interactive data visualization panel, or dashboard, for PII search results. Read More