Wrangling IRI Logs for Speed & Security Insights
Quick Overview
IRI Audit Log Wrangler (ALW), introduced with the CoSort v11 Ops Governance System (OGS), extracts actionable information from the JSON audit logs generated by SortCL-compatible executions. Using SQL- and JSONPath-compatible query syntax in .ALW scripts, CoSort users can analyze job performance and resource-control settings, while FieldShield and other SortCL users can audit sensitive-data handling, user activity, failures, and policy changes. Wrangler can also export filtered log data for reporting, analytics, graphing, or use in external log-analysis and SIEM platforms.
Abstract: This article provides practical examples of querying IRI audit logs with the Audit Log Wrangler (ALW) utility to extract actionable information. Sample ALW scripts show how IRI CoSort users can wrangle log data to analyze job performance under different resource-control settings. Other examples show how IRI FieldShield users can audit the treatment of sensitive data for compliance verification and incident tracing. The article also explains how an AI assistant can help build Wrangler scripts for your own queries.
About Audit Log Wrangler
The Audit Log Wrangler utility introduced within the CoSort v11 Ops Governance System (OGS) extracts information from JSON logs produced by SortCL-compatible executions.
SortCL scripts drive structured data integration, transformation, migration, cleansing, masking, and reporting jobs for users of:
- IRI CoSort
- IRI FieldShield
- IRI RowGen
- IRI NextForm
- IRI Voracity
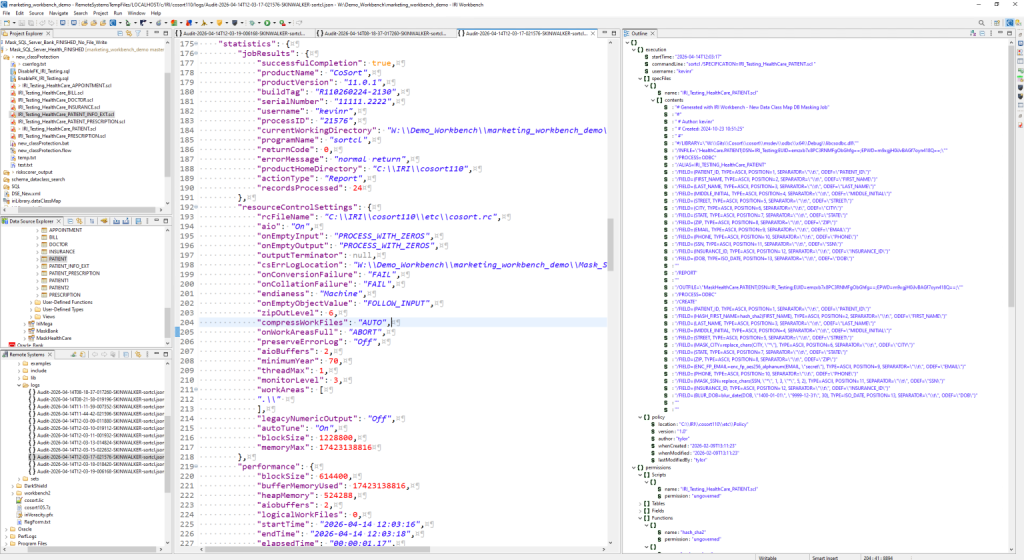
Designed for governors, auditors, and analysts, the command-line Wrangler utility parses and filters logs, generates reports, and exports delimited subsets of log data. One JSON audit log file is produced for each SortCL execution. 1 By extracting meaningful information from many detailed JSON audit logs, Wrangler helps organizations conduct security and compliance reviews and analyze job performance without requiring an external analytics platform. 2
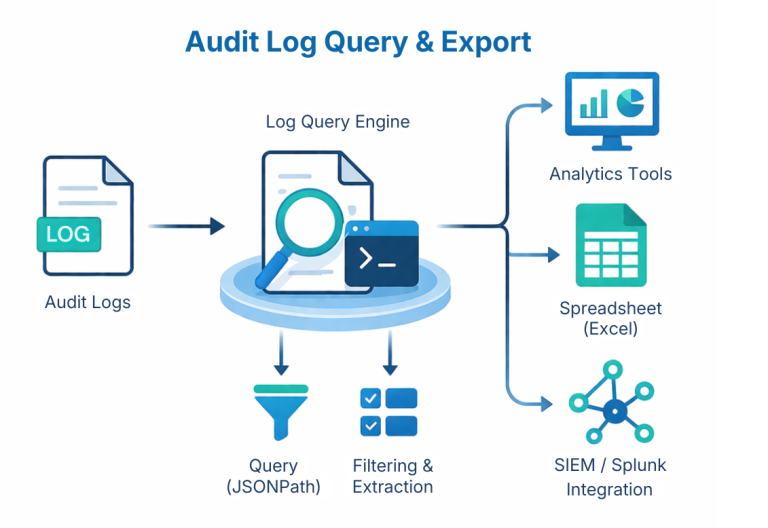
This article demonstrates some of the insights you can generate from the Audit logs using the tool’s SQL- and jQuery-compatible query syntax inside Audit Log Wrangler (.ALW) job scripts. It also explains how you can leverage the wrangler’s JPath syntax support in AI assistants such as ChatGPT to create new log queries.
Wrangler’s Modes of Operation
Audit Log Wrangler offers two primary modes of operation:
- Interactive mode
- Batch or script mode
Interactive Mode
Interactive mode provides a user-friendly command-line interface that guides users through:
- Selecting audit logs
- Defining query criteria using SQL- and JPath-compatible syntax
- Displaying results in real time
- Saving query specifications in an Audit Log Wrangler (
.ALW) script
The saved script can then be used for ad hoc or batch command-line execution.
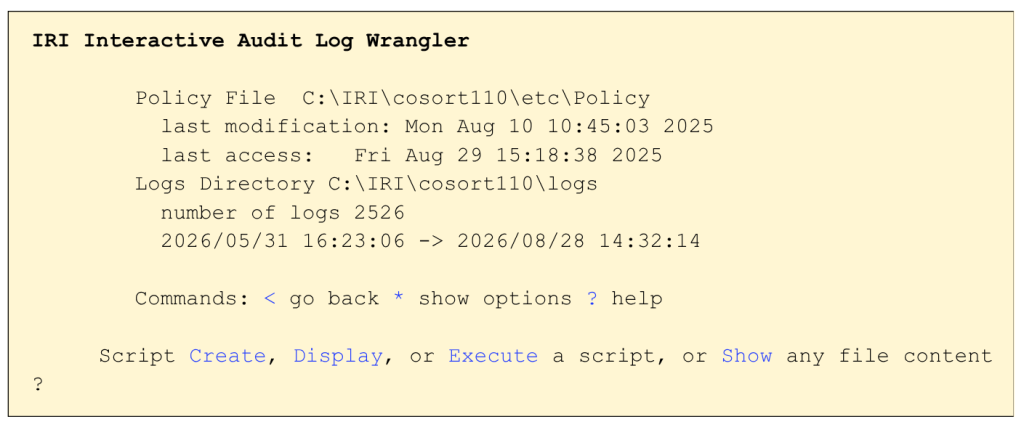
The interactive mode is ideal for exploratory analysis, debugging specific log entries, or quickly checking job performance statistics without needing to construct a formal script from scratch.
Batch or Script Mode
Batch mode supports command-line execution of existing ALW job scripts. Saving queries as .ALW files makes it possible to repeat auditing tasks and integrate log analysis into enterprise compliance-reporting workflows.
Saved scripts can be run from the interactive mode or directly from the command line, for example:
$wrangler ssnaudit3.alw
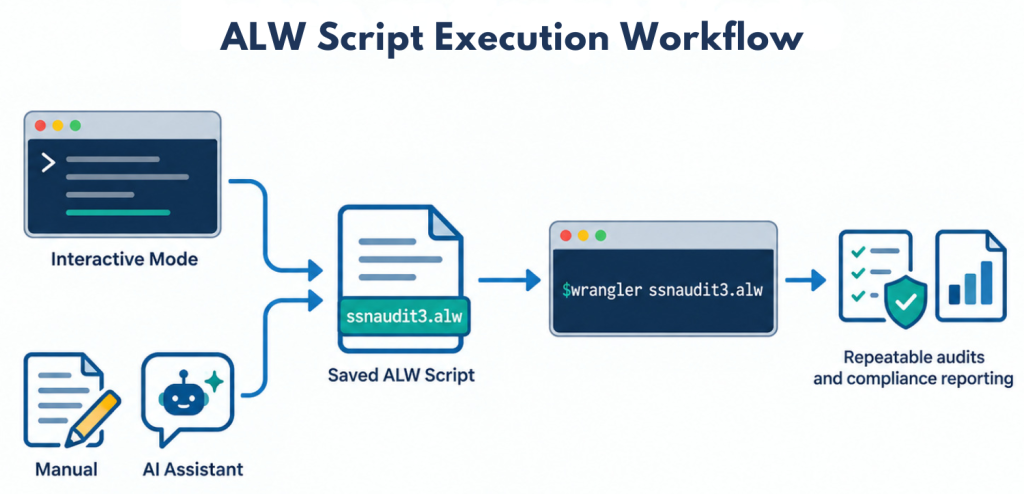
The following ALW batch script examples were generated in the Wrangler interactive mode, manually, or by an AI assistant to demonstrate real-world performance and security audits.
Speed and Performance Analysis with Audit Log Wrangler
The performance examples below show how information captured in SortCL audit logs can be wrangled to compare memory settings, thread counts, block sizes, throughput, system load, and concurrent workloads.
Speed Example #1: Improving Memory Allocation
Optimizing memory use where possible can improve system-wide performance when concurrent jobs are running. Incorrect settings can cause thrashing. This query helps identify an efficient cosortrc memory value to use when large jobs run.
Policy_Location : [C:\IRI\cosort110\etc\Policy]
Log_Location : [C:\IRI\cosort110\logs]

Range :
[Audit-2026-05-20T09-50-48-002884-CUMULUS-sortcl.json,
Audit-2026-05-20T16-28-01-018576-CUMULUS-sortcl.json]

Separator : "\t"
Out : [File,"C:\IRI\cosort110\MemoryUsageReport.out"]

Header : "JobName StartTime RAMrequested RecordsPerSecond MemoryUsed"

Select : [$.execution.specFiles[*].name]
Select : [$.execution.startTime]
Select : [$.statistics.resourceControlSettings.memoryMax]
Select : [$.statistics.performance.recsPerSecond]
Select : [$.statistics.performance.bufferMemoryUsed]

Where : [$[?(@.statistics.jobResults.recordsProcessed > 50000000)]]
The resulting report includes:
JobName                  StartTime            RAMrequested   RecordsPerSecond   MemoryUsed
["CreditCard.scl"]       2026-05-20T09:50:48  2970615808     1131913.063001     251658240
["RAME_2000000.scl"]     2026-05-20T09:52:12  3592421376     25948.006708       3592421376
["CreditCard.scl"]       2026-05-20T14:41:14  3084910592     364162.294909      41943040
["CreditCard.scl"]       2026-05-20T15:00:33  3276800000     1011127.474121     209715200
["RAME_2000000.scl"]     2026-05-20T15:02:05  3383754752     26105.924737       3383754750
["CreditCard.scl"]       2026-05-20T15:49:47  3308257280     975985.317549      167772160
["RAME_2000000.scl"]     2026-05-20T15:51:21  3020947456     25754.54004        3020947456
["CreditCard.scl"]       2026-05-20T16:00:37  3167748096     733094.278843      125829120
["RAME_2000000.scl"]     2026-05-20T16:02:33  3183476736     25833.214393      3183476736
["CreditCard.scl"]       2026-05-20T16:09:25  3382706176     431494.535735      83886080
["RAME_2000000.scl"]     2026-05-20T16:12:23  2915041280     25568.512393      2915041280
["CreditCard.scl"]       2026-05-20T16:19:16  2999975936     361469.066081      41943040
["RAME_2000000.scl"]     2026-05-20T16:22:44  3040870400     25860.772138      3040870400
The query found the two largest jobs for analysis. Their different start times reveal differences in system conditions when they ran. In these results, the highest records-per-second value for the CreditCard.scl job occurred when less memory was used.
Speed Example #2: Correlating Performance with Thread Count
Running the same representative job with different thread_max settings in the cosortrc file helps determine which setting performs best on a particular machine. The results can also help determine how many threads to license for CoSort on a given multi-core node.
Header : "specFile systemLoadPercentage threadMax elapsedSeconds"
Separator : "\t"
Out : [File,"longtimes.txt"]

Select : [$.execution.specFiles[*].name]
Select : [$.statistics.performance.systemLoadPercentage]
Select : [$.statistics.resourceControlSettings.threadMax]
Select : [$.statistics.performance.elapsedSeconds]

Where : [$.execution.specFiles[?(@.name == 'sort5_4198.scl')]]
The displayed longtimes.txt output was formatted with additional tabs for readability:
specFile              systemLoadPercentage   threadMax   elapsedSeconds
["sort5_4198m.scl"]   9                      1           62.12
["sort5_4198m.scl"]   25                     6           28.812
["sort5_4198m.scl"]   24                     5           29.419
["sort5_4198m.scl"]   24                     4           31.499
["sort5_4198m.scl"]   22                     3           31.235
["sort5_4198m.scl"]   14                     2           43.108
["sort5_4198m.scl"]   9                      1           62.316
The wrangled results above reveal that sort5_4198m.scl achieved its fastest elapsed time of 28.812 seconds with 6 threads, despite the higher system load of 25%, and that performance scaled linearly as the thread count increased.
Speed Example #3: Finding an Optimal Block Size
This query helps identify an efficient I/O setting in the resource-control file for a given job. Identifying I/O bottlenecks can save substantial processing time when jobs read or write thousands of gigabytes each day.
Out : [File,"C:\IRI\cosort110\BlockSizeAnalysis.out"]
Heading : [AUTO]

Select : [$.execution.specFiles[*].name]
Select : [$.execution.startTime]
Select : [$.statistics.resourceControlSettings.autoTune]
Select : [$.statistics.performance.recsPerSecond]
Select : [$.statistics.resourceControlSettings.blockSize]

Where : [$.execution.specFiles[?(@.name == 'CreditCard.scl')]]
Example results:
startTime             autoTune   recsPerSecond   blockSize
2026-07-31T11:43:24   Off        629591.080797   139264
2026-07-31T11:44:26   Off        663350.248756   220000
2026-07-31T11:45:01   Off        662910.507126   440000
2026-07-31T12:11:31   On         669942.273336   614400
2026-07-31T12:23:24   Off        685010.046809   1320000
2026-07-31T12:29:45   Off        694846.902142   1640000
2026-07-31T12:34:14   Minimize   668822.093412   139264
The report also includes the cosortrc value for AutoTune, which configures memory and block size dynamically at runtime.
According to the source article:
Onis usually best for jobs running alone.Minimizeis intended for multiple jobs.Offindicates that memory and block-size values were explicitly specified in thecosortrcfile.
In this test, the highest measured throughput for CreditCard.scl was associated with a block size of 1.64 MB.
For broader tuning across multiple jobs, the Where filter can be removed and job name added to the output:
Header : "JobName StartTime ElapsedTime RecordsPerSecond BlockSize"

Select : [$.execution.specFiles[*].name]
Select : [$.execution.startTime]
Select : [$.statistics.performance.elapsedTime]
Select : [$.statistics.performance.recsPerSecond]
Select : [$.statistics.resourceControlSettings.blockSize]
Select : [$.statistics.performance.systemLoadPercentage]
Speed Example #4: Identifying the Least Efficient Jobs
The records-per-second value recorded with each SortCL execution can be used to isolate performance bottlenecks. This example identifies jobs that meet a specified low-throughput threshold. Administrators can then examine the resource settings used by those jobs and determine what else may have been running on the system at the same time.
Heading : [AUTO]
Separator : "\t"
Out : [File,"slowThroughPut1.txt"]

Select : [$.statistics.performance.recsPerSecond]
Where : [$[?(@.statistics.performance.recsPerSecond <= 30000)]]
Select : [$.execution.commandLine]
Select : [$.statistics.jobResults.recordsProcessed]
Select : [$.statistics.performance.systemLoadPercentage]
Select : [$.statistics.resourceControlSettings.threadMax]
Example output:
recsPerSecond   jobName                  recordsProcessed   systemLoadPercentage   threadMax
1612.903226     ["sort5_4198m.scl"]      100                14                     4
16949.152542    ["sort5_4198m.scl"]      1000               12                     4
25759.156302    ["Replacer200.scl"]      12000006           11                     4
Another approach is to isolate jobs exceeding an elapsed-time threshold:
Select : [$.execution.commandLine]
Select : [$.statistics.performance.elapsedSeconds]
Where : [$[?(@.statistics.performance.elapsedSeconds >=100)]]
Speed Example #5: Detecting Job Slowdowns from Concurrent Workloads
This query can help identify system bottlenecks caused by other jobs starting while a SortCL job is already running. If these overlaps are not addressed, they can result in unnecessary slowdowns. The system load percentage recorded in the log can indicate that another job began during the SortCL execution, while the start time lets you compare other job or system logs to determine what was running concurrently.
Header : "ScriptName StartTime RecordsPerSecond SystemLoadPercentage"

Select : [$.execution.specFiles[*].name]
Select : [$.execution.startTime]
Select : [$.statistics.performance.recsPerSecond]
Select : [$.statistics.systemInfo.systemLoadPercentage]
The example results compare two jobs running separately on one day and concurrently the next:
ScriptName                StartTime              RecordsPerSecond   SystemLoadPercentage
["CUSTOMERS_14F.SCL"]     2026-07-29 14:14:47    606857.793062      18
["ENCRYPT_SSN.scl"]       2026-07-29 16:15:00    153830.769231      10
["CUSTOMERS_14F.SCL"]     2026-07-30 14:15:28    583998.73467       21
["ENCRYPT_SSN.scl"]       2026-07-30 14:15:31    143389.101338      27
This query can also help a system administrator quickly identify patterns such as:
- Same job + lower
RecordsPerSecond+ higherSystemLoadPercentage→ likely contention from another workload. - Same job + consistently low throughput regardless of load → likely SortCL tuning issue.
- High system load only during certain time windows → possible scheduled-application interference or overlapping batch activity.
The log element $.statistics.jobResults.processID may also be useful when correlating a SortCL execution with operating-system-level monitoring tools.
Security and Compliance Audit Examples
Audit Log Wrangler can also extract information useful for security review, compliance verification, incident tracing, access analysis, and OGS policy monitoring.
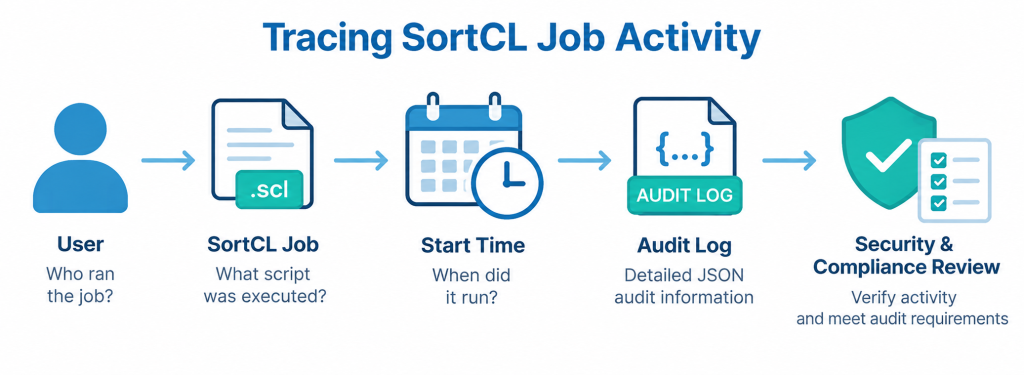
Security Example #1: Tracing Jobs by User and Time
This example helps determine who accessed particular data at a particular time, supporting investigation against company role-based access control (RBAC) and zero-trust/non-repudiation policies.
# Author: sidewind
# Written: [2026-07-07T13-32-42]

Policy_Location : [C:\IRI\cosort110\etc\Policy]
Log_Location : [C:\IRI\cosort110\logs]

Range :
[Audit-2026-05-13T16-41-07-018360-CUMULUS-sortcl.json,
Audit-2026-05-13T17-02-58-018364-CUMULUS-sortcl.json]

Heading : [AUTO]
Separator : "\t"
Out : [File,"nametest.txt"]

Select : [$.execution.username]
Select : [$.execution.specFiles[*].name]
Select : [$.execution.startTime]
Select : [logFileName]
When the script runs in Wrangler interactive mode or from the command line, results can appear on screen or be written to a delimited file such as:
username   name                      startTime              LogFileName
susan      ["sort5_4198m.scl"]       2026-05-13T16:41:07    Audit-2026-05-13T16-41-07-018360-CUMULUS-sortcl.json
susan      ["sort5_4198m.scl"]       2026-05-13T16:44:57    Audit-2026-05-13T16-44-40-018360-CUMULUS-sortcl.json
david      ["repli_2000000.scl"]     2026-05-13T16:57:56    Audit-2026-05-13T16-57-56-018441-CUMULUS-sortcl.json
jorge      ["aggregate2.scl"]        2026-05-13T17:02:58    Audit-2026-05-13T17-02-58-018593-CUMULUS-sortcl.json
With Heading : [AUTO], the displayed header contains only the final log-schema element. A custom header can be specified instead, as shown in later examples.
Security Example #2: Finding Jobs That Access PII
This query helps manage data-breach and compliance risk by identifying jobs and data sources in which a specified sensitive field was processed.
The example searches specifically for the PolicyHolder_SSN field:
Separator : "\t"
Out : [File,"c:\IRI\cosort110\logs\Job11.out"]

Header : "JobName SourceName(s) FieldName"

Select : [$.execution.specFiles[*].name]
Select : [$.statistics.dataSources[*].name]
Select : [$.statistics.dataSources[*].fieldInfo[?(@.name == 'PolicyHolder_SSN')].name]

Where : [$.statistics.dataSources[*].fieldInfo[?(@.name == 'PolicyHolder_SSN')]]
Example output:
JobName                SourceName(s)             FieldName
["sort5_4198m.scl"]    ["BIG2","BIG3","BIG4"]   ["PolicyHolder_SSN"]
["sort5_4198m.scl"]    ["BIG2","BIG3","BIG4"]   ["PolicyHolder_SSN"]
["sort6_4198m.scl"]    ["BIG2","BIG3","BIG4"]   ["PolicyHolder_SSN"]
["sort6_4198m.scl"]    ["BIG2","BIG3","BIG4"]   ["PolicyHolder_SSN"]
In this case, PolicyHolder_SSN was processed in two SortCL jobs, each of which ran twice.
The article intentionally abbreviates the top portions of this and subsequent Wrangler scripts for space and shows only the relevant Select and Where queries needed to produce the results.
Security Example #3: Detecting Permission Violations and Failed Jobs
This ALW script identifies SortCL jobs that failed for any reason, including attempts to execute on an unlicensed hostname or failures caused by user access restrictions defined in the Policy File.
Separator : "\t"
Out : [File,"C:\IRI\cosort110\BlockedJobs.out"]

Header : "StartTime User JobName ReturnCode ErrorMessage"

Select : [$.execution.startTime]
Select : [$.execution.username]
Select : [$.execution.specFiles[*].name]
Select : [$.statistics.jobResults.returnCode]
Select : [$.statistics.jobResults.errorMessage]

Where : [$[?(@.statistics.jobResults.successfulCompletion == false)]]
The result in the BlockedJobs.out file can contain entries such as:
StartTime              User    JobName                 ReturnCode   ErrorMessage
2026-05-10T10:14:37    joker   ["Group1000.scl"]       46           license violation: incorrect node or invalid key
2026-05-12T14:32:18    polly   ["ClaimMasking.scl"]    210          Permission Denied
2026-05-20T11:47:05    ethan   ["CustExtract.scl"]     46           license violation: incorrect node or invalid key
2026-05-20T13:08:54    susan   ["PolicyReport.scl"]    210          Permission denied
2026-05-20T15:26:41    joker   ["Group1000.scl"]       46           license violation: incorrect node or invalid key
For error 46, the source article specifies examining the hostname in the log and sending IRI the contents of RegForm.txt and the machine’s cosort.lic file to determine the mismatch.
For error 210 Permission Denied, the governor should examine the user and job name (.scl script) against the active Policy File. The PFM utility can show that user’s permissions for the job script’s elements, or forms.
Security Example #4: Spotting Policy File Changes
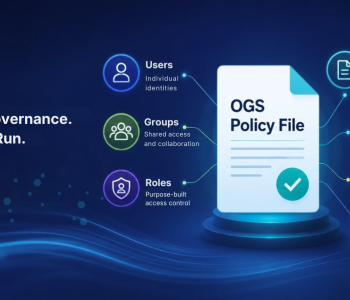
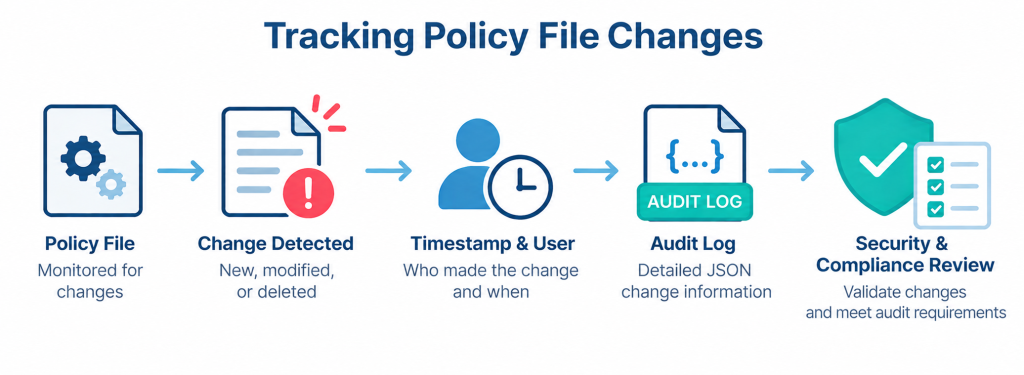
This report supports change tracking and non-repudiation by monitoring modifications to the IRI Operational Governance System (OGS) Policy File.
Separator : "\t"
Out : [File,"c:\iri\cosort110\polmod.out"]

Select : [$.execution.username]
Select : [$.execution.startTime]
Select : [$.execution.commandLine]
Select : [$.execution.policy.whenModified]
Selected polmod.out results:
...
susan   2026-05-20T16:22:29   sortcl /spec=example37.scl         2026-02-23T19:19:35
susan   2026-05-21T16:22:29   sortcl /spec=Group1000.scl         2026-02-23T19:19:35
susan   2026-05-21T16:22:29   sortcl /spec=example21.scl         2026-02-23T19:19:35
...
susan   2026-05-26T12:44:44   sortcl /spec=R_NAME_2000000.scl    2026-02-25T11:04:15
susan   2026-05-26T13:27:54   sortcl /spec=SORT_NAME_2000000.scl 2026-02-25T11:04:15
susan   2026-05-26T13:22:03   sortcl /spec=SORT_NAME_10000.scl   2026-02-25T11:04:15
susan   2026-05-26T14:27:38   sortcl /spec=SORT_NAME_20.scl      2026-02-25T11:04:15
When the report identifies a Policy File change, security officers can investigate PFM utility archives or Policy File change logs to determine exactly what policy changed, when the change occurred, and which OGS administrator, or governor, made it.
Using AI to Generate ALW Scripts
Because IRI OGS logs use JSON format and Wrangler parses them with JPath syntax, AI assistants such as ChatGPT, Claude, Copilot, and Gemini can help generate new queries. Users can describe the desired query in natural language and provide the AI assistant with enough information about the audit-log structure and Wrangler syntax to construct a corresponding .ALW script.
You will need to provide the AI engine with the log structure and specific requirements to build the script. A full sample log file, together with a representative ALW script from this article or the Wrangler section of the OGS manual that includes a SELECT and WHERE clause, should provide sufficient context.
Workflow for Getting AI Help with an ALW Script
- Gather Context: Collect a sample JSON audit log file or the relevant audit-log schema from the OGS manual, so the AI assistant can understand the data format.
- Formulate the Request: Write a clear, descriptive prompt defining the goal of the audit.
- Specify the Required Format: Tell the AI assistant to return the script using the specific
SELECTandWHEREsyntax required by Wrangler.
Example AI Prompt Template
You can adapt the following template to the query you need:
“I need to generate an IRI OGS Audit Log Wrangler (.alw) script. Here is a sample script: [Paste one here] and sample IRI OGS audit log from a SortCL job: [Upload or paste a sample log file or its schema here].
Please create an .alw script that performs the following action: [Describe your goal, e.g., ‘Find all jobs where the user is ‘susan’ and the job result was unsuccessful’].
Follow these Wrangler syntax guidelines:
– Specify fields with SELECT : [JPath].
– Apply filtering with WHERE : [JPath condition].
– Include standard headers like Policy_Location and Log_Location as placeholders.
– Include today’s date in the comments and use a default or custom header as shown.
– Specify a logical name for the tab-separated [or other-separated] output file”
Key Elements to Include in Your Scripts
When reviewing an ALW script generated by an AI assistant, verify that it contains the components used in successful .ALW files:
- Script header information: Policy File path and filename, log-folder location, log-date range, output filename for the extract, and delimiter character or separator.
- Output header format:
Heading : [AUTO]uses the final element in the JSON key name unless a custom header is provided in quotes. - Query logic:
SELECTstatements identify fields to display, while aWHEREclause filters for a condition using JPath syntax. - Comments: Lines beginning with
#can document the script’s purpose, author, and date.
By providing the schema and a clearly defined query goal, you can map your requirements to Wrangler’s JPath query capabilities and produce a fit-for-purpose .ALW job script.
FAQ

What does IRI Audit Log Wrangler do?
Audit Log Wrangler extracts information from the JSON audit logs generated by SortCL-compatible executions. It can parse, filter, report on, and export selected log information for performance analysis, security review, compliance auditing, and related operational analysis.
What is the difference between interactive and batch mode?
Interactive mode guides the user through selecting logs, defining query criteria, viewing results, and saving an ALW script. Batch mode executes previously saved .ALW scripts from the command line and is suitable for repeatable audit and reporting workflows.
Can Audit Log Wrangler help identify jobs that process PII?
Yes. The article demonstrates an ALW script that searches audit-log metadata for a specified sensitive field—in the example, PolicyHolder_SSN—and reports the SortCL job and source names associated with that field.
Can Audit Log Wrangler help diagnose performance problems?
Yes. The examples in this article use logged information such as memory allocation, thread count, records per second, block size, elapsed time, and system load to compare job executions and investigate performance differences.
Can AI assistants generate Audit Log Wrangler scripts?
The article describes using AI assistants to help generate .ALW scripts when they are given the audit-log schema or a representative log, an example Wrangler script, the desired query, and instructions for using Wrangler’s JPath SELECT and WHERE syntax.
Summary
Audit Log Wrangler is a companion to the OGS audit-logging framework that converts raw JSON job logs into requested information for compliance, data security, performance tuning, and operational oversight.
Wrangler uses targeted filtering, secure sharing, and structured reporting to help organizations make full use of the rich metadata in OGS without letting its volume or complexity overwhelm them. Wrangler’s JPath query support also makes it possible to provide an AI assistant with a representative audit log or schema, a sample .ALW script, and a description of the desired query so that the assistant can help construct another ALW script.
Together with the Policy File, PFM utility, and script signature system, Wrangler forms part of the operational governance environment for SortCL-driven jobs in IRI CoSort, FieldShield, NextForm, RowGen, and Voracity production environments.
For questions or assistance using IRI Audit Log Wrangler, contact support@iri.com.
- Note that log files can be large and can contain information about job execution, permissions, statistics, resource control settings, performance, metadata aggregates, system information, information about data sources and targets (including data class, field, and function details specified for each), licensing details, and environment variables. See the OGS manual for the full log schema, and this article on ways to control log file growth.
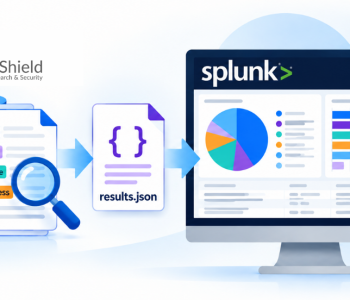
- You can also use Wrangler to extract the query results to delimited files suitable for analytics and graphing in tools like Excel. You can also export full IRI job logs directly, or the wrangled extracts, to more purpose-built log analytics and visualizing platforms and SIEM tools like Datadog and Splunk Enterprise Security.