The IRI Workbench GUI for DarkShield produces multiple output logs from search and masking operations. More specifically, DarkShield jobs built in the Workbench and run through the on-premise DarkShield APIs for searching and masking generate actionable dashboard charts plus human and machine-readable log files which auditors can examine or export for analysis in other log visualization tools like Splunk, Grafana and Datadog.
Here is a complete listing of all the DarkShield job (log) artifacts currently available:
- PII discovery annotations and masking results, in separate JSON files, for searching and masking jobs run from IRI Workbench (and thus through a DarkShield API)
- Operational audit logs with user and runtime details, also in JSON, for each job run from IRI Workbench or in CLI mode
- PII discovery results, in delimited text format, for reporting through IRI CoSort SortCL, Excel, Splunk, etc.
- Workbench error log output, sent directly to the Workbench error log
- Logs for DarkShield API server operations, sent to the target(s) defined in a secure log4j2 configuration file in the conf directory of a DarkShield API distribution
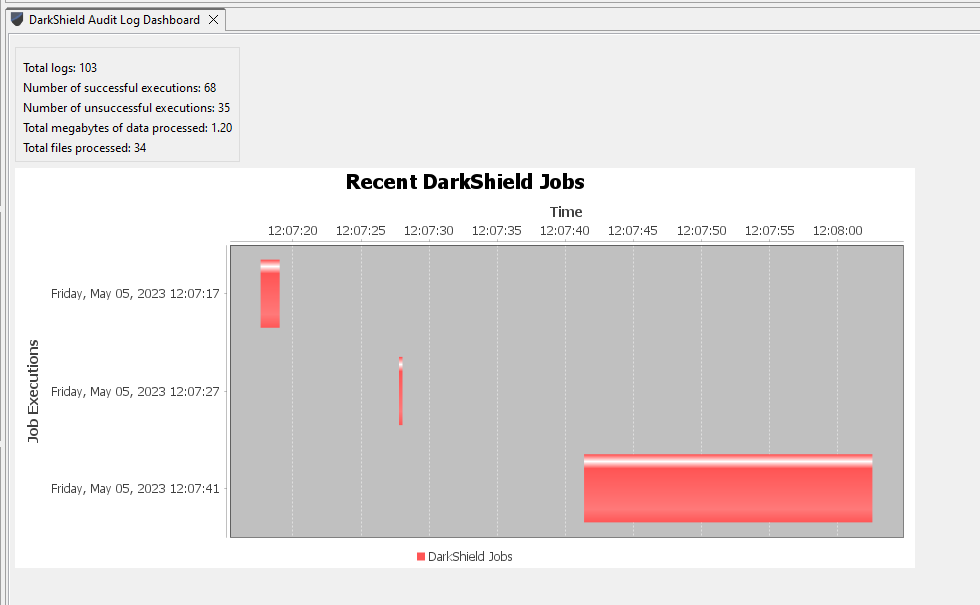
- A self-updating audit log dashboard view for DarkShield API jobs displaying the number of unsuccessful completions, and total volume of data processed. A Gantt chart can also be displayed to show DarkShield job execution times over a period of time.
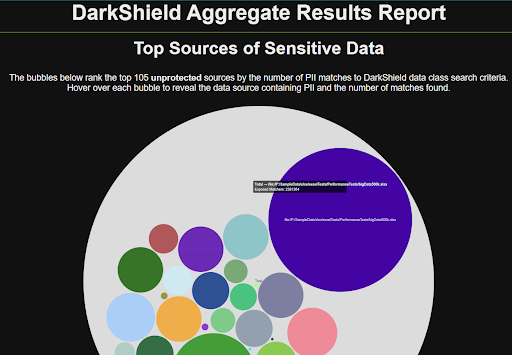
- An actionable Graph option, accessible from the context menu when right-clicking a .dsc file, generates an HTML file that has displays dashboard charts of aggregate DarkShield (search) annotation and (masking) results data. These charts allow you interact with summary data more visually.