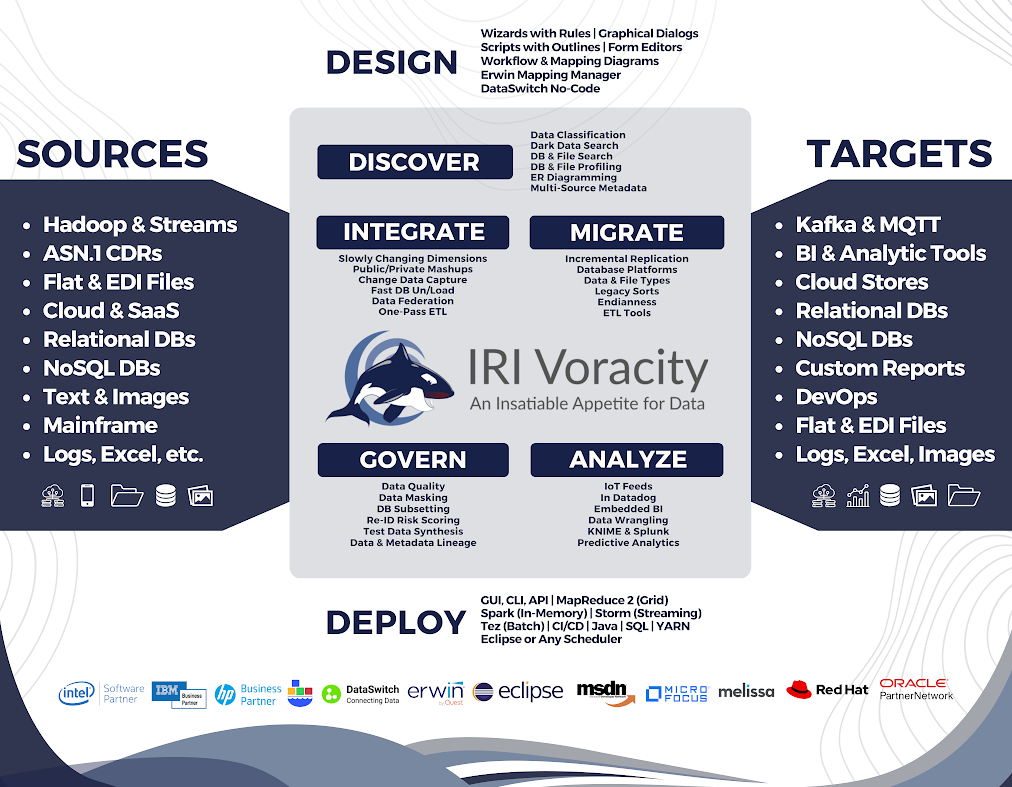
Through the Workbench GUI, IRI Voracity offers more data display and delivery options than any other platform, and all in one place.
In the same Eclipse™ IDE, Voracity gives you everything you need to prepare, present, and provide comprehensive custom results for production or prototype data ... for all the right people in all the right formats.
Display
As opposed to ETL-integrated BI (which is inefficient), Voracity is BI-integrated ETL on steroids. Use any combination of these options to meet your visualization needs and budget:
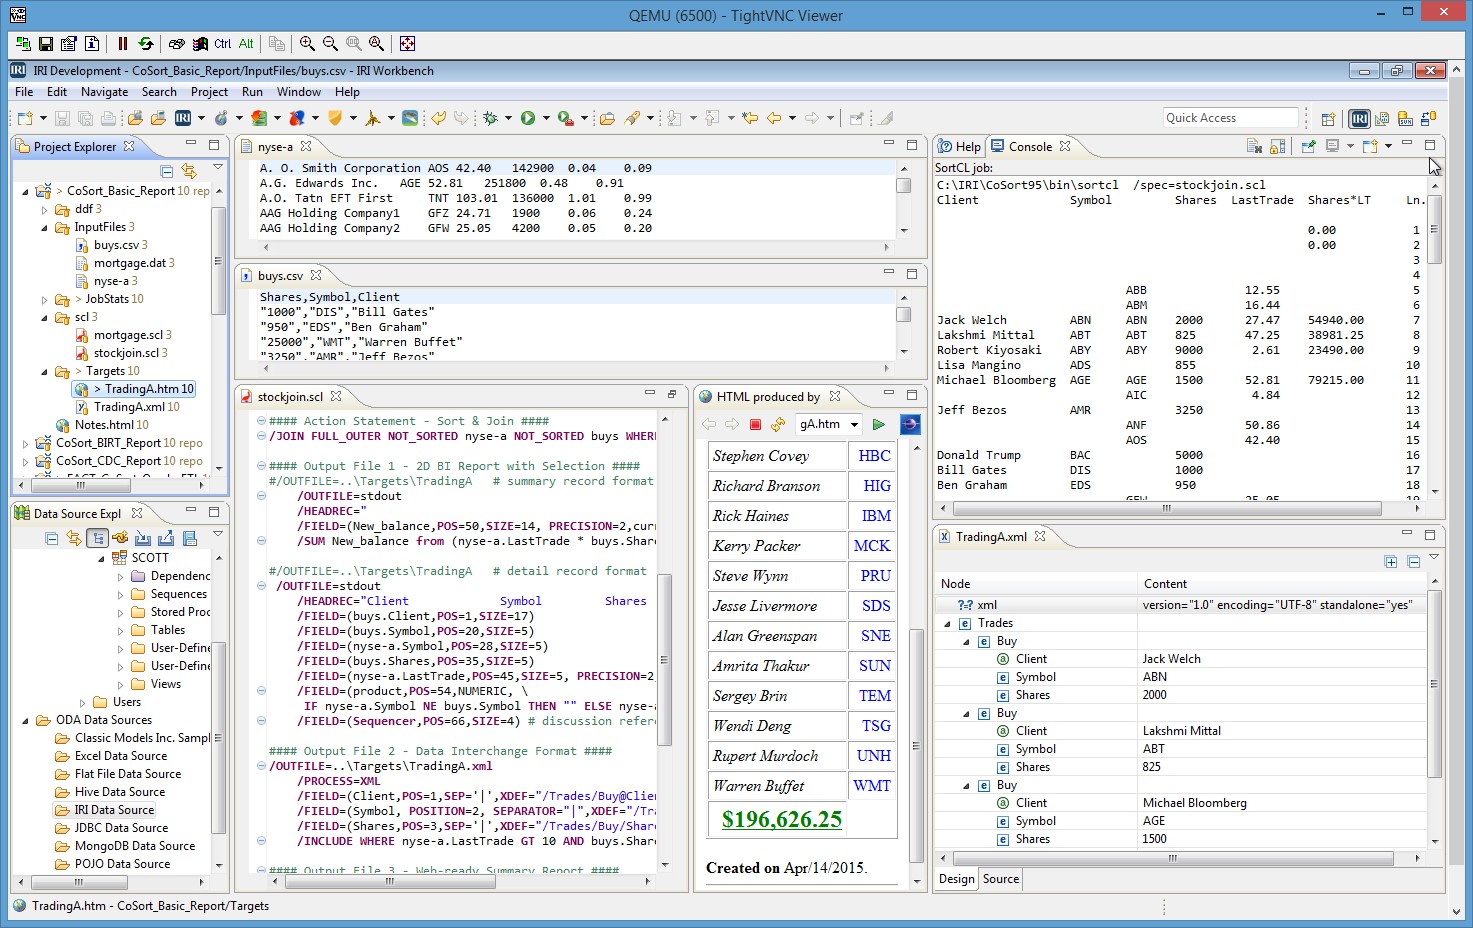
Embedded BI
Embedded reporting capabilities allow you to drive BI results on big data as you transform it. The built-in formatting capabilities in all IRI products let you capture the value of information seamlessly and in the shortest amount of time.
 Learn More
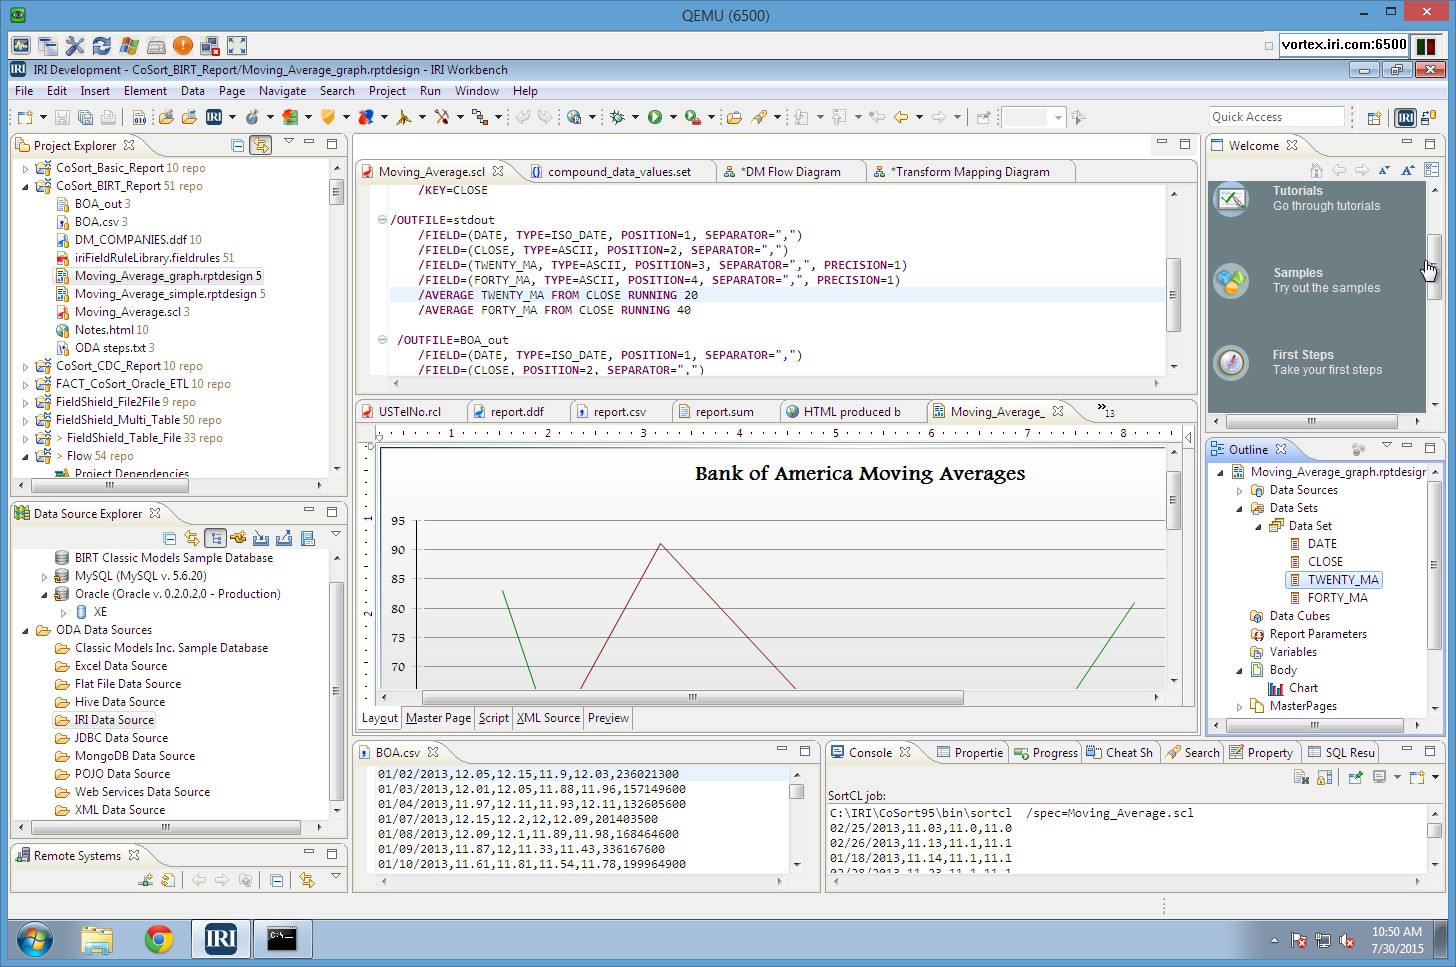
BIRT & KNIME
The Business Intelligence Reporting Tool (BIRT) is a free data visualization tool in Eclipse™. IRI has used the ODA API in BIRT and the CoSort engine in Voracity to combine data preparation and presentation in real-time.
The Konstanz Information Miner (KNIME) is a free analytics and visualization platform with extensive data mining, machine learning, deep learning, and visualization nodes for data science. The "Voracity Provider for KNIME" is a data source node for KNIME workflows that rely on pre-populated table data, and can accelerate end-to-end ETL-related data wrangling to visual outcomes up to 10X.
 Learn More
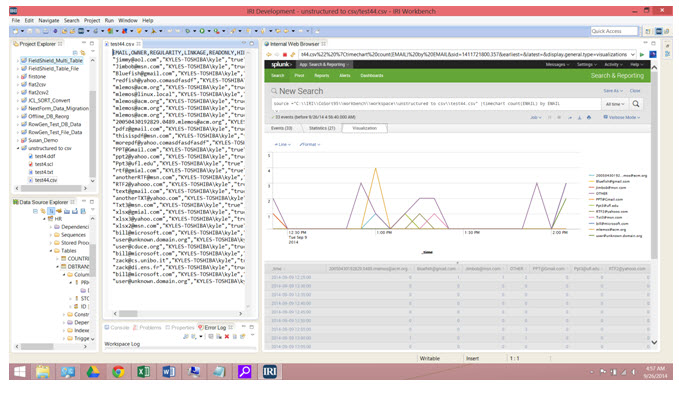
Splunk Options
Put Splunk into overdrive. IRI's free Splunk app or add-on for Voracity -- or use of the Splunk Universal Forwarder with Voracity -- all simultaneously index big or dark data prepared in Voracity. Clean, transform, and mask your data as you feed it into Splunk for analytics and action!
 Learn More
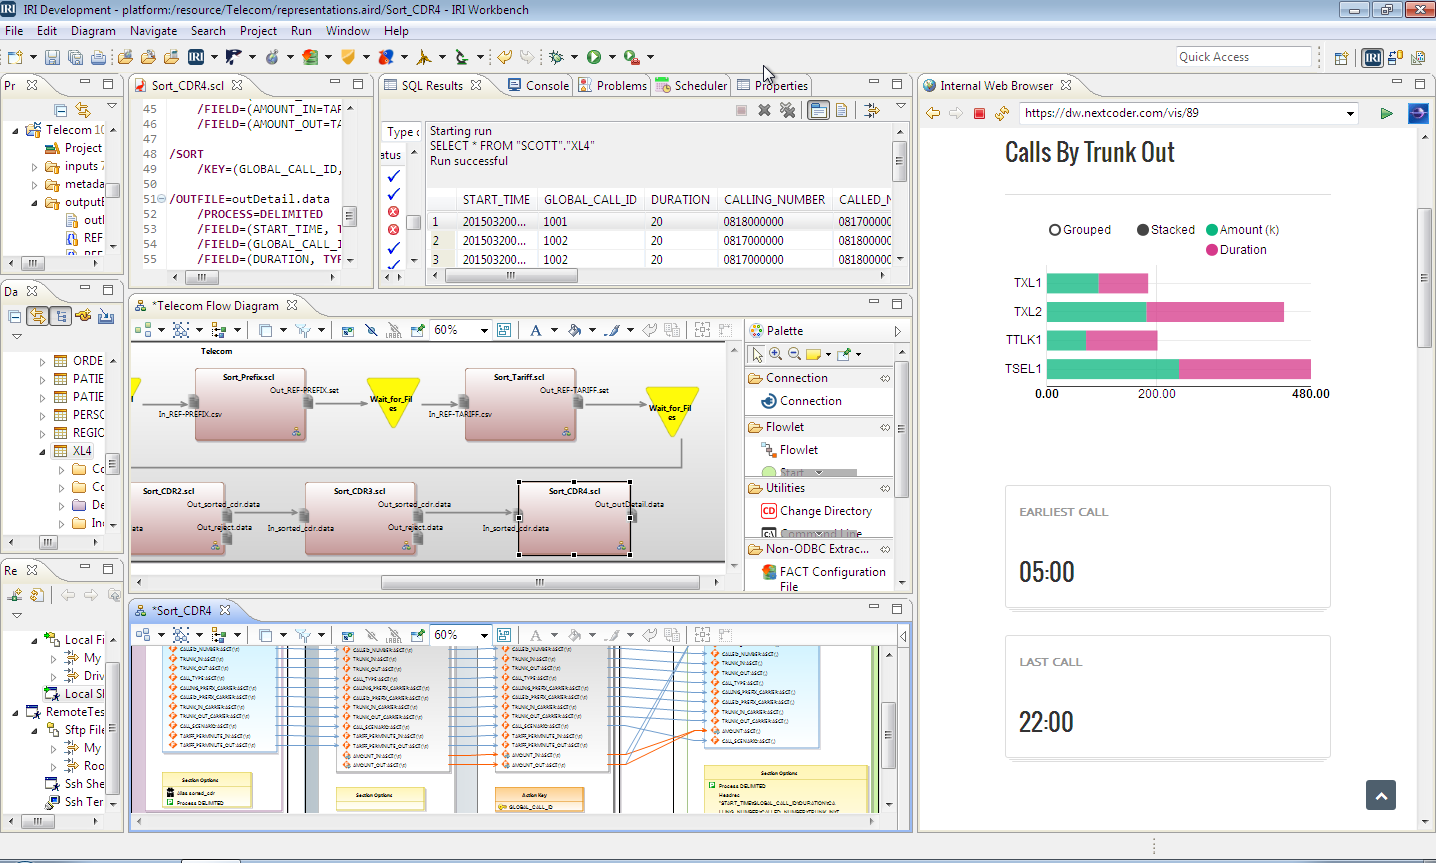
Cloud Dashboard
See and learn more with a modern dashboard inside the IRI Workbench GUI or your browser. Visualize and interact with data you can first transform, cleanse, and mask in Voracity. Prepare data anywhere and see information everywhere.
 Learn More
Your Analytic Tool
Stop trying to transform, clean, and mask data in slow BI, DB, ETL, and specialty data blending software. Click on your tool below to see how you can discover and prepare data in Voracity -- with the proven performance of CoSort or Hadoop engines -- and get clean, compliant subsets your tool can use to render displays up to 20X faster:


Voracity can also be used to do some predictive analytics in its own right (with simultaneous preparation and graphic), or Kafka-feed streaming analytic partner platforms like JupiterOne. Learn more about what makes Voracity a "Production Analytic Platform" here .
Deliver
Voracity has the rare ability to produce any number of database, file, and custom report targets -- with real production or realistic test data results -- in all kinds of legacy and modern formats at the same time. This saves design time and execution time by consolidating more work into the same jobs and I/O passes.
Review this schematic to understand all the targets your Voracity jobs can feed in the same GUI-designed pass: